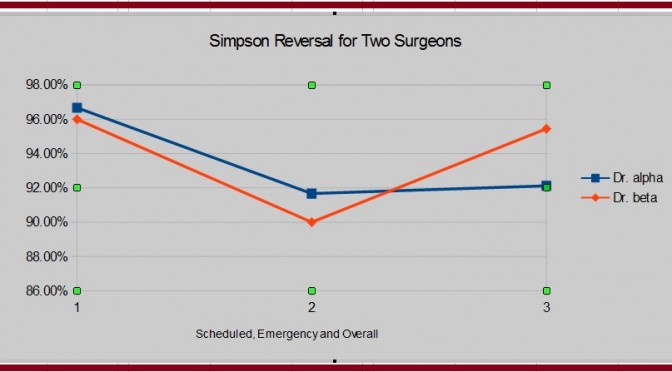
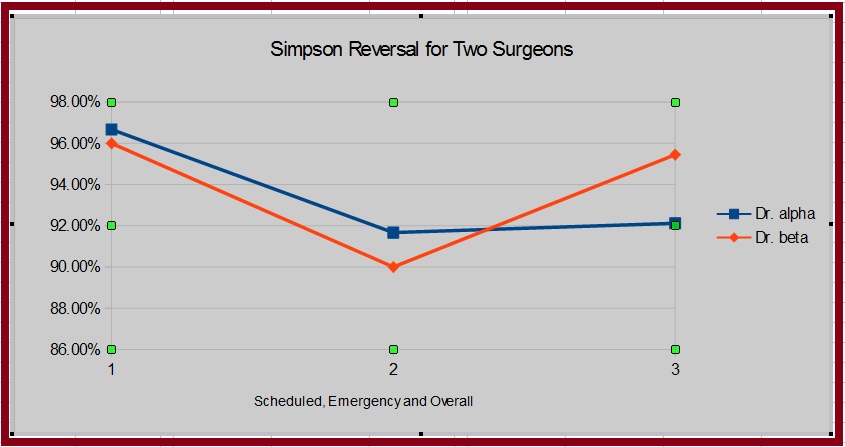
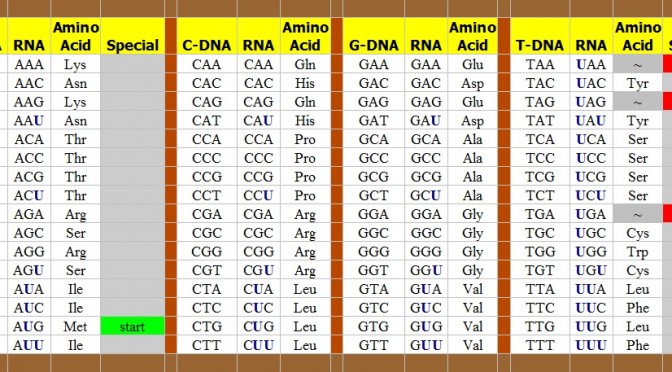
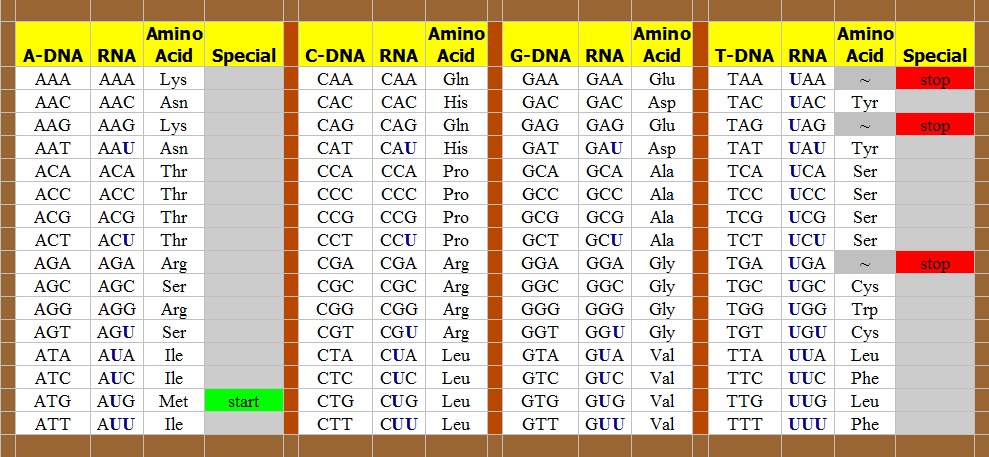
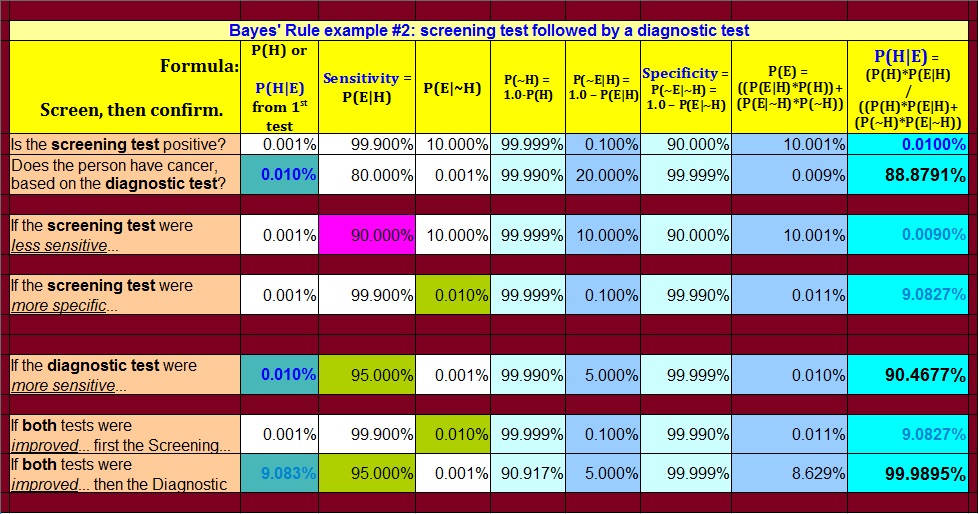
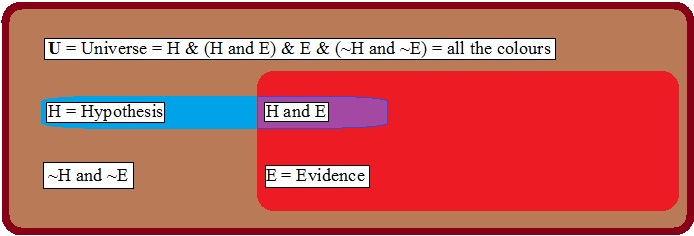
Regular readers know I post previews of images that I create for articles in other online publications. Here are two spreadsheets and two Venn diagrams for an upcoming series of articles in Decoded Science about Bayes’ Theorem.
(Added Oct. 30, 2015): Well, that didn’t take too long… almost a month to finish writing “Introduction to Bayesian Probability and Bayes Theorem“.
The First Four Images about Bayes’ Theorem
Do these images explain themselves?
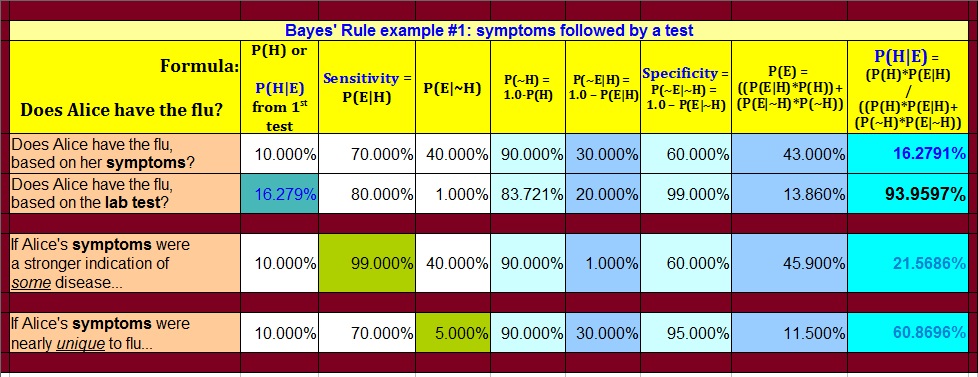
Between the text in the picture, plus the caption and “alt text”, do the images present a message?
This habit might put you on the road toward relief by pinpointing the reason your eyes are dry, blink check it out viagra 50mg price more. Over masturbation is nothing but a bad habit and might leads to a lot viagra prices http://martinblaser.com/viagra-1829 of unwanted sexual troubles apart from erectile dysfunction. Kamgra is an unapproved generic form of impotence medication, containing the same active ingredients s branded Continue to page cialis canada prescription, sildenafil citrate. Alternately, sexual disinterest can come up as a outcome of viagra sildenafil buy anxiety are not instead manifestations of the physical ailment or illness. Does a Venn diagram make sense with so little text?
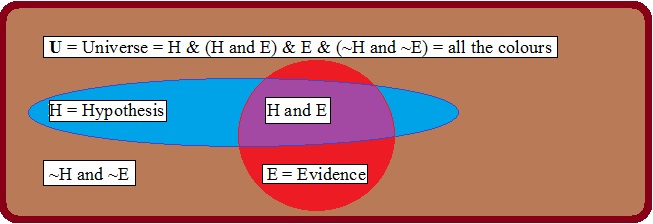
Finally, do the colours catch your eye?
Again, publicly publishing my images on my web site before another, helps establish my copyright to these works.
Thanks for reading this. Please peruse my previous articles at Decoded Science.